
Sins of Extrapolation
Trends Don't Continue Forever.

Welcome to Young Money! If you’re new here, you can join the tens of thousands of subscribers receiving my essays each week by adding your email below.
Video Software TO THE MOON
On September 1st, 2020, Zoom's stock price jumped 41% after the company revealed one of the most impressive quarters by any business, ever. The videoconferencing company had 355% year over year revenue growth, growing from $146M to $664M in quarterly revenue.

They onboarded big-name clients like ExxonMobil and Activision Blizzard, more than doubled customers that generated >$100k in revenue, and increased Free Cash Flow by 2,079% from $17.1M to $373.4M. This was a once-in-a-lifetime quarter, that would only be hypothetically possible if a pandemic-induced lockdown forced the world's white collar workforce into remote environments.
Right.
As a result of this phenomenal quarter, Zoom gained $37B in market value in a single day. Because as we all know, markets are, in fact, efficient.
Zoom's meteoric run continued into October, when the stock price hit $560 as the company was briefly valued at $160B. At the same time, ExxonMobil, one of Zoom's newest clients and one of the world's biggest energy companies, was worth $140B.
In October 2020, analysts from Bank of America, D.A. Davidson, and Bernstein raised their one year price targets for the communications company to $570, $600, and $611, respectively. While Zoom had 2% operating margins and traded at 211x forward earnings, this was no concern for finance's fortune tellers.
One year later, much to Wall Street's surprise, Zoom was down 50%, trading at $270 per share. Six months after that, the battered video conferencing stock fell back below $100, marking an 82% decline in 17 months.
Today, Zoom's total market cap is equal to its one-day gain on September 1st, 2020, and the stock is worth roughly the same valuation as it was in July of 2019.
Zoom wasn't some standalone fallen angel, either. Peloton and Roku, two other "Covid beneficiaries", have fallen by 80%+ from their peaks as well.

Sell-side researchers completely missed their marks (sad!), and ExxonMobil is now worth 10x as much as Zoom Communications. What happened?
Sins of extrapolation.
Pattern Recognition in a Mean-Reversion World
Extrapolating at the wrong time can lead to some... interesting results. For example, extrapolating a recent Gallup poll on American sexuality shows that 200% of Americans will be gay in 2072.
Extrapolating in finance leads to some outlandish projections as well.
At its peak, Zoom traded at a price to sales (P/S) multiple of 69 (lol). Meanwhile, the S&P 500's average P/S over the last five years has been right around 2.3. Now there is a caveat here: Zoom had just produced 355% year-over-year revenue growth. That is a ridiculous figure that warrants a valuation premium to the rest of the index.
However, the correct question wasn't "Is Zoom's growth impressive?"
It was "Is Zoom's growth sustainable?"
The answer to that question is, of course, NO.
As we were approaching our one year pandemic anniversary, the majority of companies had made the necessary adjustments to accommodate remote work. While most would probably re-up their deals with Zoom, where was new user growth going to continue coming from? 355% growth, specifically?
What happens when people return to offices, would Zoom still be needed at the same scale? When Zoom inevitably doesn't generate back to back years of 300%+ revenue growth, what happens to its nosebleed valuation?
But no one was asking these second-order questions. The chart was going up, and price movement needed to be justified. No catalyst had trigged a valuation compression, and the pattern looked like it would continue up and to the right, so analysts extrapolated the last 12 months of data.
We humans are compelled to find patterns to understand our world. This isn't a flaw; the human brain has literally evolved over thousands of years to help us find patterns. This trait was paramount thousands of years ago: we needed to track prey, avoid danger, and take cues from our environment around us.
However, our propensity for finding patterns often leads us to assume that patterns exist in areas where they do not. This can be quite dangerous when we extrapolate patterns in places that are prone to mean reversion.
This danger is amplified because evidence for patterns looks strongest when the likelihood of mean reversion is highest. Is it going up forever, or is a return to reality imminent?
What would a sell-side analyst report look like if they saw a roulette wheel hit red 20 times in a row?
"After seeing the wheel operator's previous execution, our target is a continuation of 50 more perfect red spins."
Poor Timing
We extrapolate at the worst possible times because it takes time to collect the evidence used for extrapolation. You couldn't extrapolate Zoom's meteoric run when the pandemic started, because it took months for the stock to gain momentum. It was only after Zoom had climbed 620% in less than a year, after we were nine months in to a raging pandemic, after Zoom had eclipsed ExxonMobil's valuation, that we could confidently say, "Oh yeah. This is the one. Zoom to the moon."
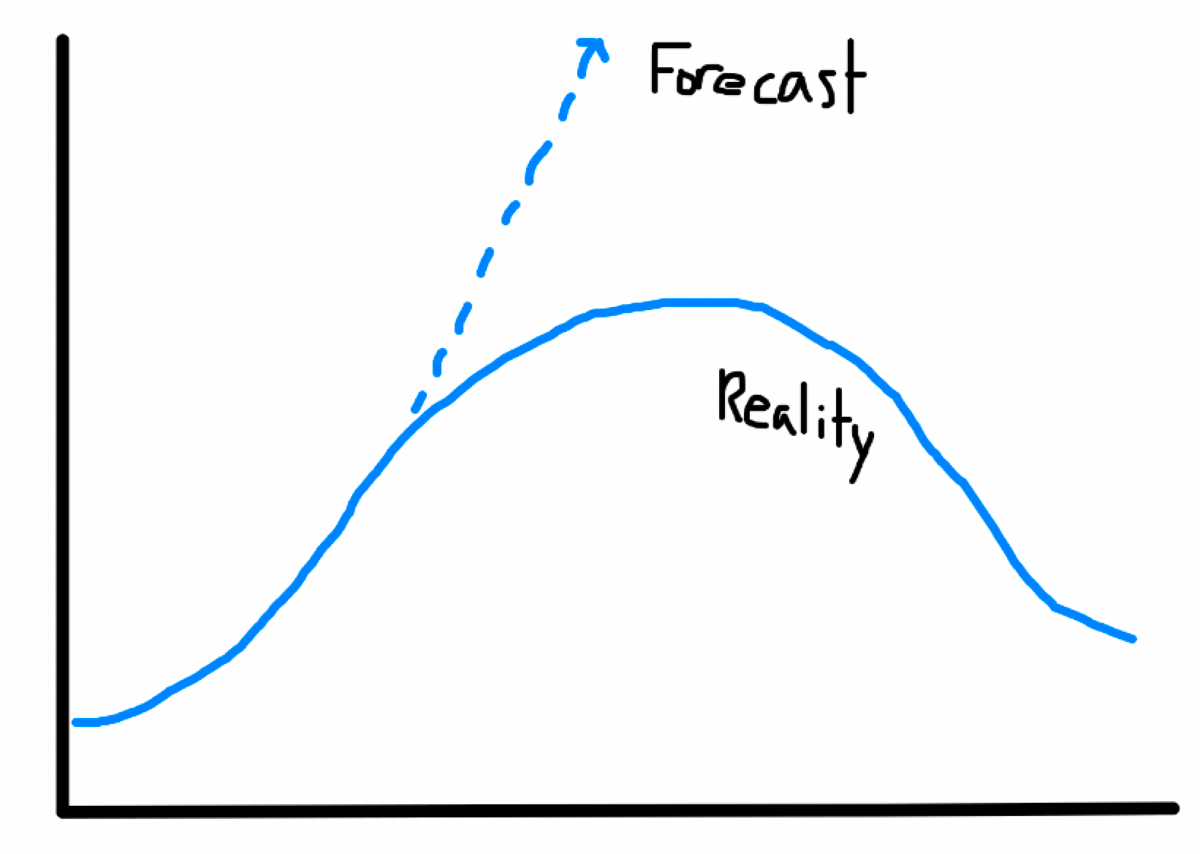
For the more visually inclined, pattern-based forecasts look like this.
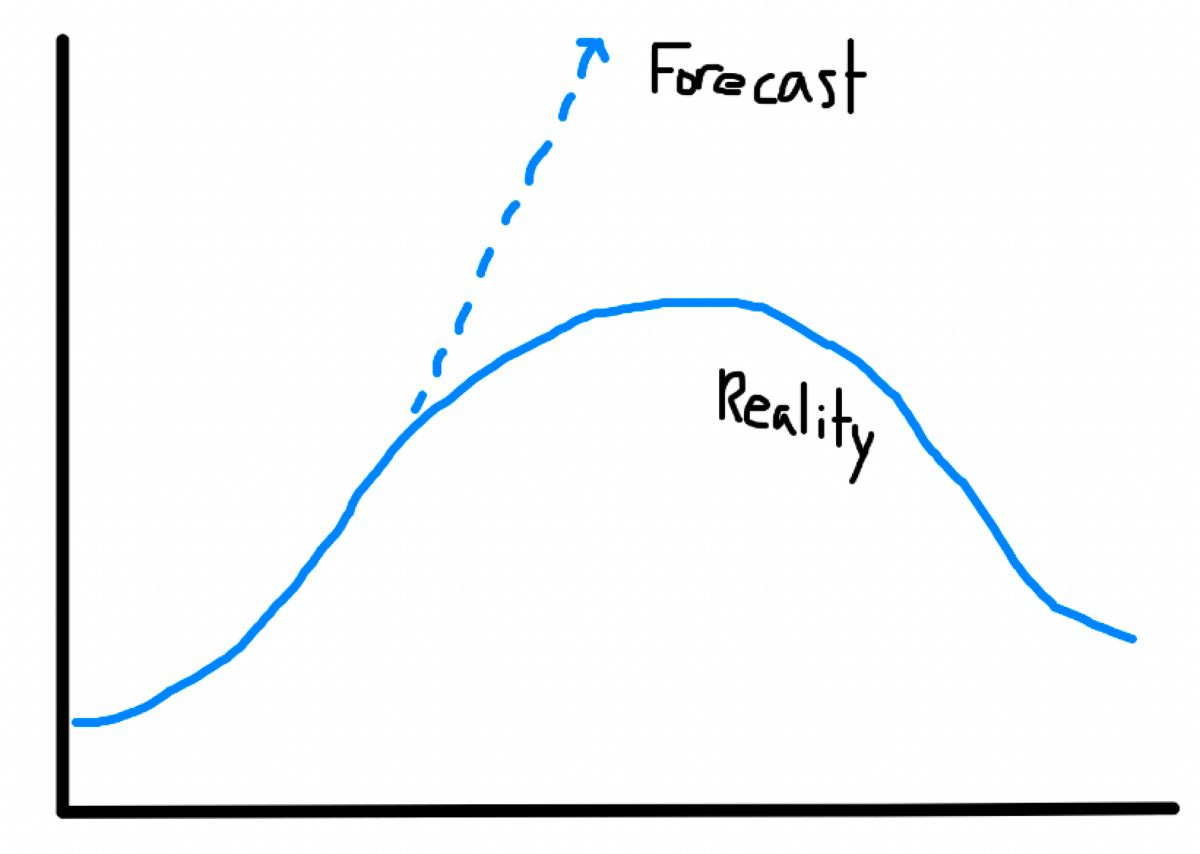
The same moment that the market "priced in" Zoom's pandemic performance, and the stock was unlikely to further outperform the broader market, researchers felt safest to give even higher price targets. No one predicted Zoom would hit $500 a share when it was sitting at $200. Everyone predicting $600+ when it was at $550.
While investors grew more and more confident as the price continued to climb, Zoom was racing towards an inflection point. Even without vaccines and return-to-work orders, there was just no way that the company could hit another 300% gain. Factor in a "return to normalcy", and the forecasts get grim quickly.
This isn't just a stock thing, it's a life thing. We are pattern-seeking creatures in a mean-reverting world, and the second that something seems inevitable, our predictions are proven false.
Just as the Golden State Warriors looked poised to create the greatest dynasty in history, they suffered injuries, lost to the underdog Toronto Raptors, and their MVP power forward moved on to New York.
For years now we have been hearing that overpopulation would destroy our planet, but the warnings have flipped to underpopulation now that western birth rates are falling below replacement rate.
Coming off of dominant campaigns, professional athletes are often awarded massive nine-figure contract extensions. Yet these extensions typically hit as the athletes approach their peaks, leading to expensive salaries for aging players.
Greece's global dominance was all-but inevitable after Alexander the Great conquered most of the known world in just 13 years, yet his empire fell apart immediately after he died at 32 years of age.
History is full of countless more examples, but you get the idea. We are pattern-seeking creatures in a mean-reverting world.
And that's what makes extrapolation so dangerous; it seems the most convincing during times that risk is the highest.
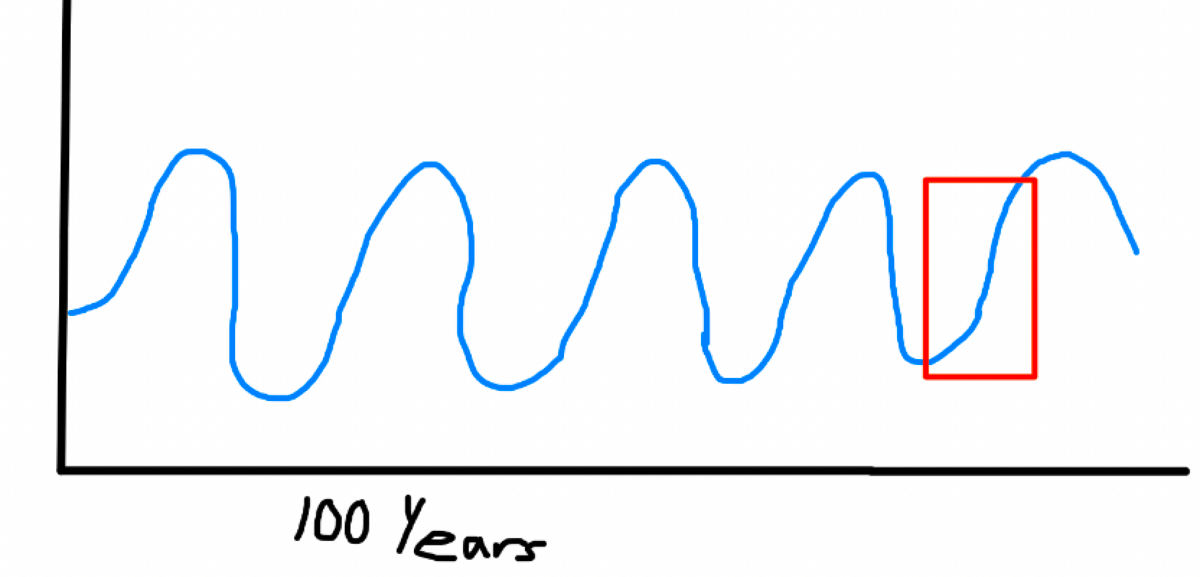
Zoom Out
The irony of Zoom's price decline is that this was, in itself, part of a larger pattern. While Zoom's individual price chart had only moved in one direction (up), the history of the stock market is full of examples of valuation mean reversion.
All one has to do is check the Nasdaq from 2000-2002 to see what happens when valuation multiples get way ahead of themselves, but we get so caught up in the short-term trends that we miss the big picture.
We tend to discount the past and give an outsized importance to what's going on right now. We give a premium to our own experiences. The thing is, the past was just as real to others as our present is to us. History is a collection of present moments for the billions who came before us, yet we ignore history to our own detriment.
Securities analysts in the late 90s were extrapolating forecasts just like analysts in 2021. But today's 20 and 30-something hot shots didn't trade through the dot-com bubble, and 2020's 'growth investors' had never seen valuation compression.
18 months feels like an eternity when growth stocks go up 500%, the pandemic is raging, and value investing has been left for dead.
18 months is just long enough for people to forget what "normal" looks like.
After 18 months, analysts have to justify these crazy moves somehow, because our entire financial system revolves around quarterly earnings and annual price targets. So valuation models are rewritten, price to sales becomes the new price to earnings, and stocks only go up.

But 18 months is nothing to the history of financial markets. Time and time again, extrapolated "trends" are mistaken for patterns and paradigm shifts.
Nothing good lasts forever, and when risk does happen, it tends to happen fast. Don't lose the big picture by focusing on short-term trends, or you might find yourself on the wrong side of mean reversion.
- Jack
I appreciate reader feedback, so if you enjoyed today’s piece, let me know with a like or comment at the bottom of this page!
Young Money is now an ad-free, reader-supported publication. This structure has created a better experience for both the reader and the writer, and it allows me to focus on producing good work instead of managing ad placements. In addition to helping support my newsletter, paid subscribers get access to additional content, including Q&As, book reviews, and more. If you’re a long-time reader who would like to further support Young Money, you can do so by clicking below. Thanks!